Debugging in blazor
Blazor supports full debugging in blazor server side. But, if you work with client-side you still have the opportunity to debug your code. At the writing moment, there is only early support of debugging blazor webassembly apps and there are some limitations.
- Only
int,stringandbooltype variables are observable - Classes and their properties and fields are not observable
- Hover to observe is not working
- Execute code expressions in the console is not working
- Step into async methods is not working
Anyway, debugging allows to set and remove breakpoins, observe local variables of int, string and bool types. Also you can see call stack including when js call .net and vise versa.
Prerequisites
- You need chrome +70 version
How to
1.NOTE. The debugger works only for Http. Https in not working
- Run your app
- Open your client app in chrome
-
Press
Shift+Alt+D. You get the following message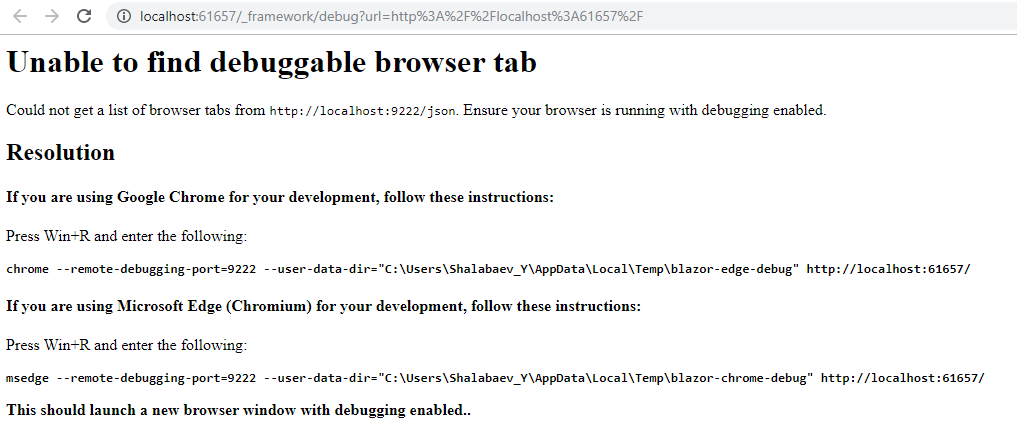
- Follow instructions
- Open a new instance of chrome as the instruction says
- Press
Shift+Alt+Dagain -
New page will be open
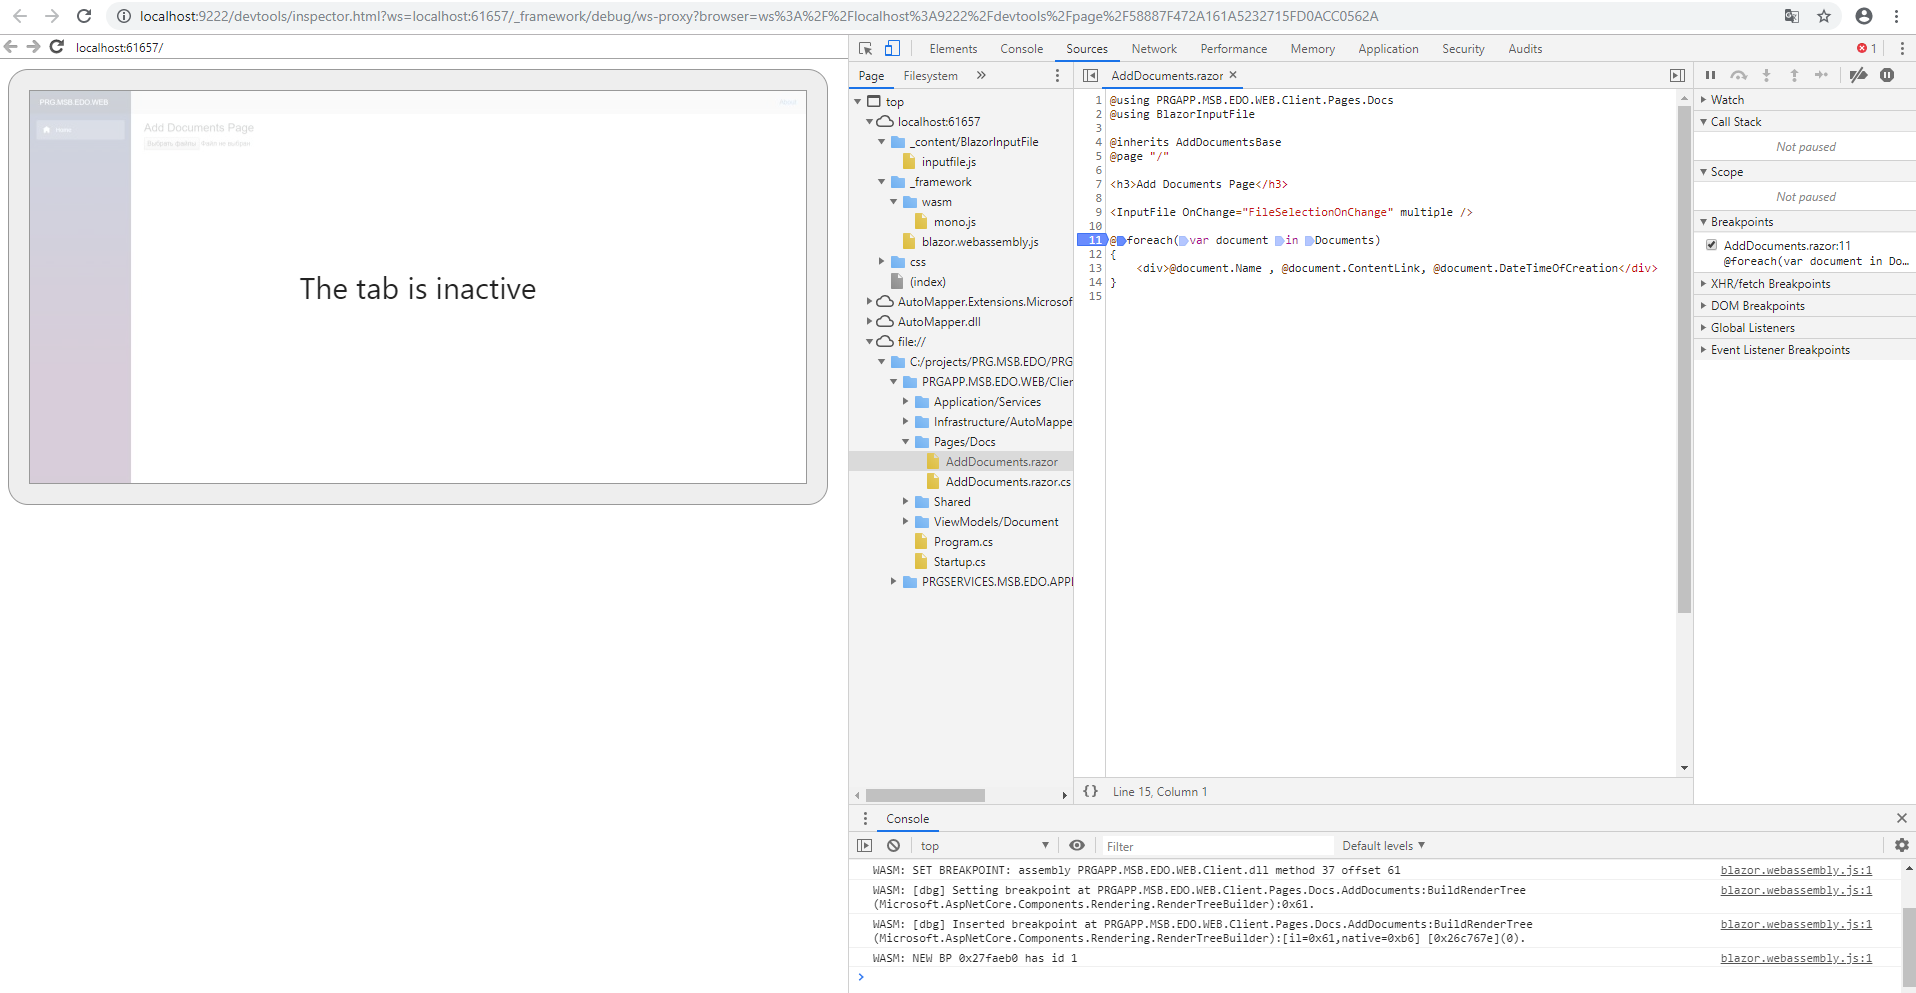
- Go to the
Sourcestab. In the left side, gotopageand find your code infile:// - Set breakpoint
Conclusion
You have ability to debug your code, observe variables and analyze call stack. It is not fully featured, however, it is more than nothing.
